LiDAR System Ideal for Aerial Mapping
The primary reason that surveyors are switching from photogrammetry to LiDAR mapping systems is to obtain point clouds under trees, foliage and high canopies. This brings up the question: how can the point density of the point clouds produced by a LiDAR system be increased in these environments?
The first factor in increasing point density is the number of laser beams being generated by the LiDAR sensor. The more beams the higher the point density. Thus, LiDAR scanners such as the Velodyne HDL-32E and VLP-32C, with 32 laser beams, will produce, under the same conditions, double the point density as a 16 beam LiDAR sensor, the Velodyne VLP-16. Multiple-returns also allows separating the bare terrain from the surface features. The current LiDAR sensors offered with the Geo-MMS LiDAR system can record up-to 2 returns, last and strong. The strong return reflects from the surface (canopy) and the last return records after penetration through leaves and foliage providing returns from the bare earth under the foliage as shown below.

Bare Earth Captured with Geo-MMS LiDAR system under the Foliage
Two additional parameters under our control directly affect point density 1) flight altitude and 2) platform speed. As an example of the effect of flight altitude on point density, consider the VLP-16 LiDAR scanner and assume a fixed speed of 5m/s. In this case, the point density increases from 230 points/m2 at a 40m altitude to 460 points/m2 at 20m as illustrated in the figure below:
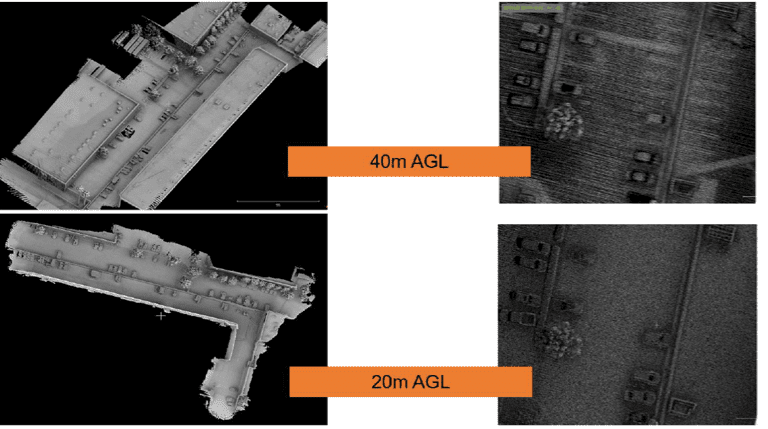
Point Density Shown Increased From 230 points:m2 at a 40m Altitude to 460 points:m2 at 20m
As an example of the effect of platform speed on point density, assume a fixed altitude of 40m, the point density will increase from 230 points/m2 at the speed of 5m/s to 460 points at a speed of 2.5m/s.
The tradeoff for a given desired point density is thus between flight altitude and flight speed. As shown in the table below:
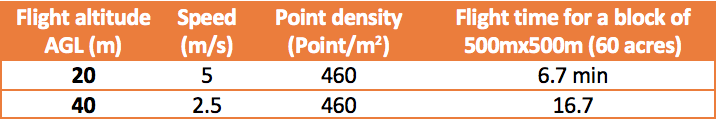
Flight Altitude and Flight Speed Table
The table also shows that for a given point density e.g. 460 points/m2, you can choose to either fly at 20m AGL at a speed of 5m/s, or fly at 40m AGL at a speed of 2.5m/s. Note that in the first case, the flight duration for an area of 500mx500m would be approximately 7min and in the second case will increase to 16min.
Next, we consider collecting data in high-foliage areas. In these cases, an additional factor can be used to increase the point density – LiDAR frequency or RPM (rotation per minute). The RPM setting directly effects the resolution of the point cloud and indirectly effects the point density. The figure below illustrates the impact of the RPM setting on point density.
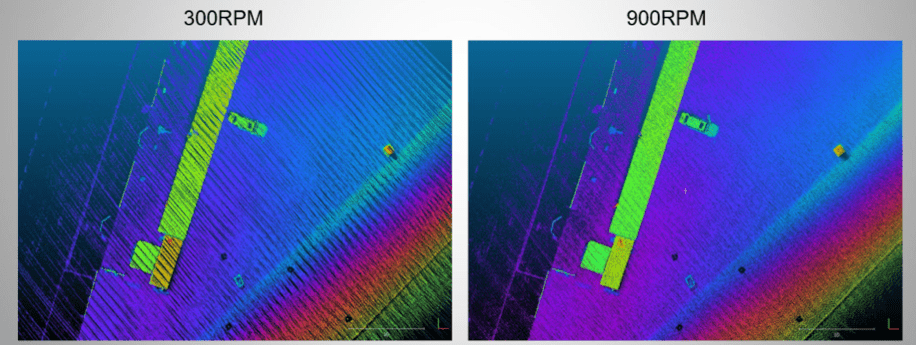
Illustrates the Impact of the RPM Setting on Point Density
In summary, the key in increasing the point density for areas with high canopy trees lies in controlling three flight mission parameters: 1)flight altitude, where the lower the altitude, the higher the point density, 2) flight speed, where the slower the flight, the higher the point density, and 3) LiDAR RPM setting, where the higher the RPM, the higher the point density. By carefully controlling these parameters, the probability of penetrating through leaves and foliage and provide returns from the bare earth under the foliage is increased. The figure below shows sample data collected with the Geo-MMS LiDAR (VLP-16) at 30m AGL, speed of 3m/s, and 1200 RPM.
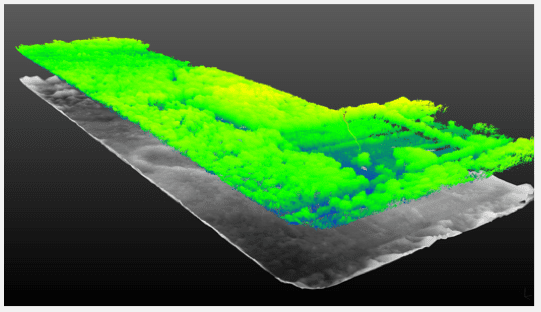
Represents Sample Data Collected With the Geo-MMS LiDAR (VLP-16) at 30m AGL, Speed of 3m:s, and 1200 RPM
All of these parameters are critical in planning flight missions for given environments. For this reason, Geodetics includes flight mission planning tools with its Geo-MMS products. More information on these tools is available here.
